Plot the solution to an L0 segmentation problem
plot.spike_estimates.RdPlot the solution to an L0 segmentation problem
# S3 method for spike_estimates
plot(x, xlims = NULL, ...)
Arguments
| x | output from running spike_estimates |
|---|---|
| xlims | optional parameter to specify the x-axis limits |
| ... | to be passed to methods |
Examples
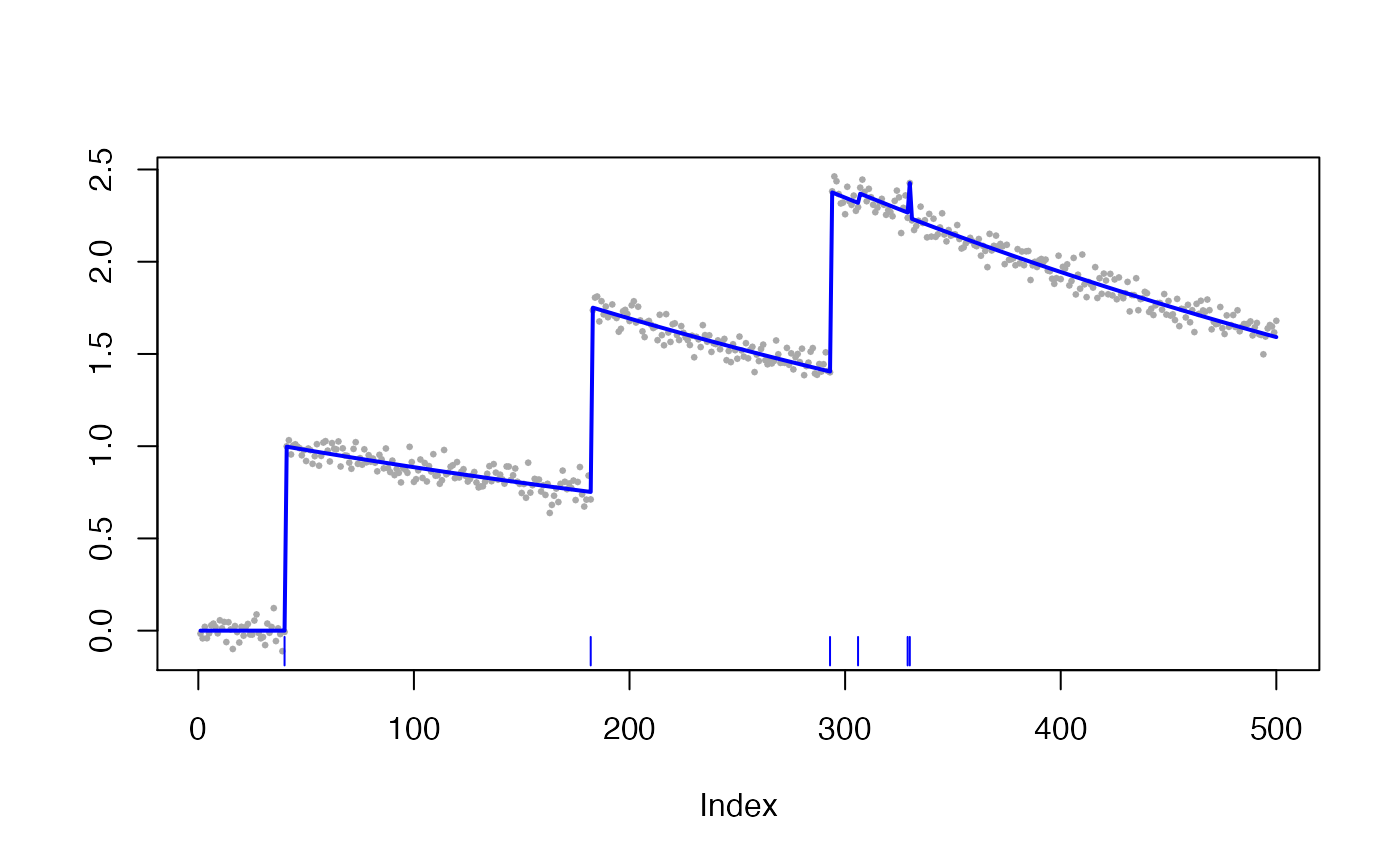
### Generate sample data sim <- simulate_ar1(n = 500, gam = 0.998, poisMean = 0.01, sd = 0.05, seed = 1) ### Fit the spike fit_spike <- spike_estimates(sim$fl, decay_rate = 0.998, tuning_parameter = 0.01) ### Plot estimated spikes plot(fit_spike)