Summarize the inferential result for hierarhical clustering
summary.hier_inference.RdSummarize the inferential result for hierarhical clustering
# S3 method for hier_inference
summary(object, ...)
Arguments
- object
output from running `test_hier_clusters_exact_1f`
- ...
to be passed to methods
Value
A data frame with summarized results
Examples
# Simulates a 100 x 2 data set with three clusters
set.seed(123)
library(CADET)
dat <- rbind(c(-1, 0), c(0, sqrt(3)), c(1, 0))[rep(1:3, length=100), ] +
matrix(0.2*rnorm(200), 100, 2)

# Average linkage hierarchical clustering
hcl <- hclust(dist(dat, method="euclidean")^2, method="average")

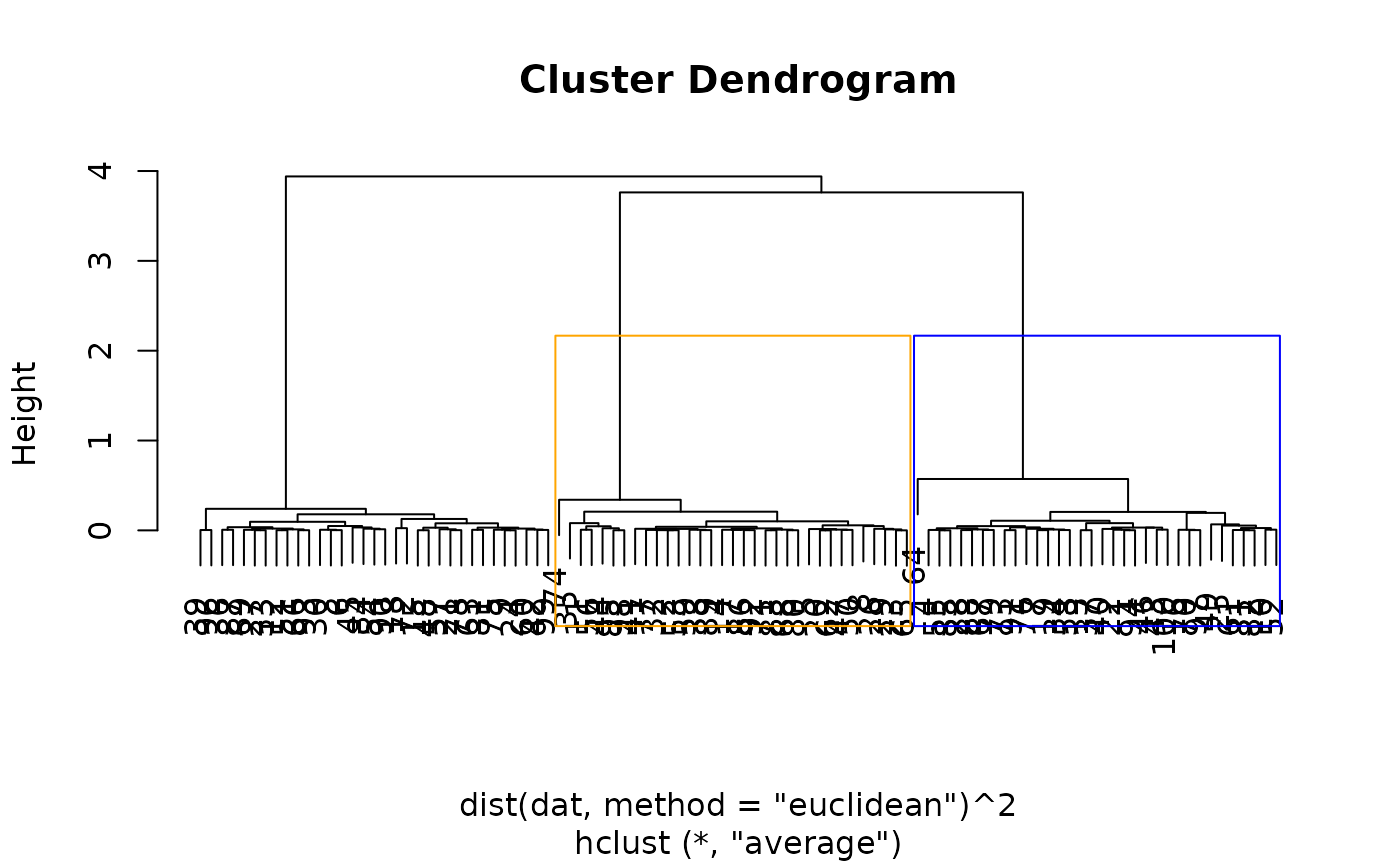
# plot dendrograms with the 1st and 2nd clusters (cut at the third split)
# displayed in blue and orange
plot(hcl)
rect_hier_clusters(hcl, k=3, which=1:2, border=c("blue", "orange"))


# tests for a difference in means between the blue and orange clusters
# with respect to the 1st feature
cl_1_2_feat_1 <- test_hier_clusters_exact_1f(X=dat, link="average", hcl=hcl, K=3, k1=1, k2=2, feat=1)
summary(cl_1_2_feat_1)
#>   cluster_1 cluster_2  test_stat  p_selective      p_naive
#> 1         1         2 -0.9469145 1.001053e-06 2.002035e-06