Exact significance test (with respect to a single feature) for hierarchical clustering
test_hier_clusters_exact_1f.RdThis tests the null hypothesis of no difference in means in the mean of
feature feat between clusters k1 and k2 at
level K in a hierarchical clustering. (The K clusters are
numbered as per the results of the cutree function in the
stats package.)
test_hier_clusters_exact_1f(
  X,
  link,
  hcl,
  K,
  k1,
  k2,
  feat,
  indpt = TRUE,
  sig = NULL,
  covMat = NULL
)
Arguments
- X
\(n\) by \(p\) matrix containing numeric data.
- link
String selecting the linkage. Supported options are
"single", "average", "centroid", "ward.D", "median", and"mcquitty".- hcl
Object of the type
hclustcontaining the hierarchical clustering of X.- K
Integer selecting the total number of clusters.
- k1, k2
Integers selecting the clusters to test.
- feat
Integer selecting the feature to test.
- indpt
Boolean. If
TRUE, assume independent features, otherwise not.- sig
Optional scalar specifying \(\sigma\), relevant if
indisTRUE.- covMat
Optional matrix specifying \(\Sigma\), relevant if
indisFALSE.
Value
- stat
the test statistic: the absolute difference between the mean of feature
featin clusterk1and the mean of featurefeatin clusterk2- pval
the p-value
- trunc
object of the type
Intervalscontaining the conditioning set
Details
In order to account for the fact that the clusters have been estimated from the data, the p-values are computed conditional on the fact that those clusters were estimated. This function computes p-values exactly via an analytic characterization of the conditioning set.
Currently, this function supports squared Euclidean distance as a measure of dissimilarity between observations, and the following six linkages: single, average, centroid, Ward, McQuitty (also known as WPGMA), and median (also kown as WPGMC).
By default, this function assumes that the features are independent. If known,
the variance of feature feat (\(\sigma\)) can be passed in using the
sigma argument; otherwise, an estimate of \(\sigma\) will be used.
Setting ind to FALSE allows the features to be dependent, i.e.
\(Cov(X_i) = \Sigma\). If known, \(\Sigma\) can be passed in using the covMat argument;
otherwise, an estimate of \(\Sigma\) will be used.
References
Yiqun T. Chen and Lucy L. Gao "Testing for a difference in means of a single feature after clustering". arXiv preprint (2023).
See also
rect_hier_clusters for visualizing clusters k1 and k2 in the dendrogram;
Examples
# Simulates a 100 x 2 data set with three clusters
set.seed(123)
library(CADET)
dat <- rbind(c(-1, 0), c(0, sqrt(3)), c(1, 0))[rep(1:3, length=100), ] +
matrix(0.2*rnorm(200), 100, 2)
# Average linkage hierarchical clustering
hcl <- hclust(dist(dat, method="euclidean")^2, method="average")
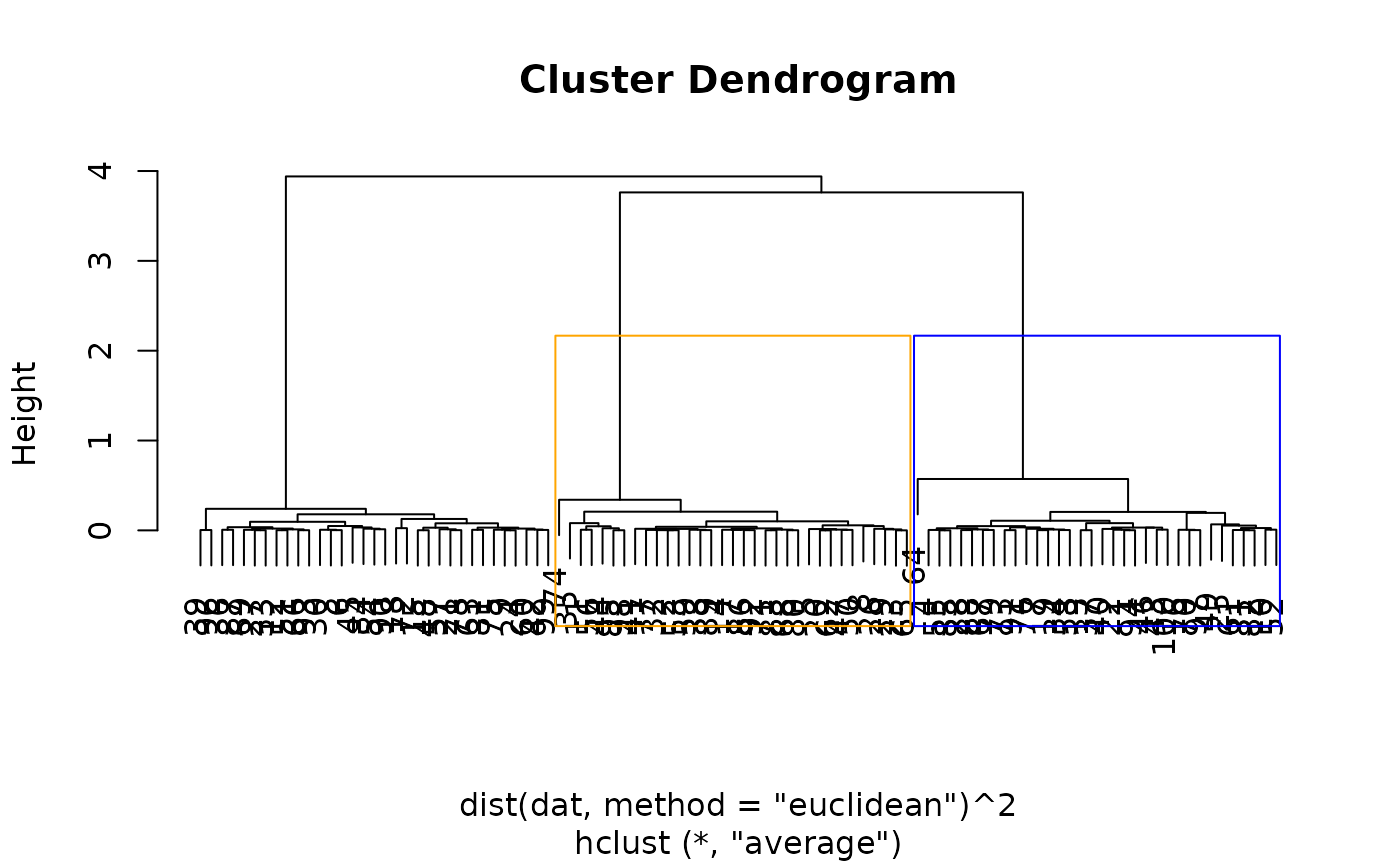
# plot dendrograms with the 1st and 2nd clusters (cut at the third split)
# displayed in blue and orange
plot(hcl)
rect_hier_clusters(hcl, k=3, which=1:2, border=c("blue", "orange"))
 # tests for a difference in means between the blue and orange clusters
# with respect to the 1st feature
test_hier_clusters_exact_1f(X=dat, link="average", hcl=hcl, K=3, k1=1, k2=2, feat=1)
#> $stat
#> [1] -0.9469145
#>
#> $cluster_1
#> [1] 1
#>
#> $cluster_2
#> [1] 2
#>
#> $pval
#> [1] 1.001053e-06
#>
#> $p_naive
#> [1] 2.002035e-06
#>
#> $trunc
#> Object of class Intervals
#> 2 intervals over R:
#> (-Inf, 0.791767114050557)
#> (4.48600166611002, Inf)
#>
#> $linkage
#> [1] "average"
#>
#> attr(,"class")
#> [1] "hier_inference"
# tests for a difference in means between the blue and orange clusters
# with respect to the 1st feature
test_hier_clusters_exact_1f(X=dat, link="average", hcl=hcl, K=3, k1=1, k2=2, feat=1)
#> $stat
#> [1] -0.9469145
#>
#> $cluster_1
#> [1] 1
#>
#> $cluster_2
#> [1] 2
#>
#> $pval
#> [1] 1.001053e-06
#>
#> $p_naive
#> [1] 2.002035e-06
#>
#> $trunc
#> Object of class Intervals
#> 2 intervals over R:
#> (-Inf, 0.791767114050557)
#> (4.48600166611002, Inf)
#>
#> $linkage
#> [1] "average"
#>
#> attr(,"class")
#> [1] "hier_inference"