Plot the result of quantifying the uncertainty of spikes estimated via an L0 penalty
plot.spike_inference.RdPlot the result of quantifying the uncertainty of spikes estimated via an L0 penalty
# S3 method for spike_inference
plot(x, alpha = 0.05, xlims = NULL, ...)
Arguments
| x | output from running spike_inference |
|---|---|
| alpha | significance threshold for displaying spikes |
| xlims | optional parameter to specify the x-axis limits |
| ... | to be passed to methods |
References
Chen YT, Jewell SW, Witten DM. (2021) Quantifying uncertainty in spikes estimated from calcium imaging data. arXiv:2103.0781 [statME].
Examples
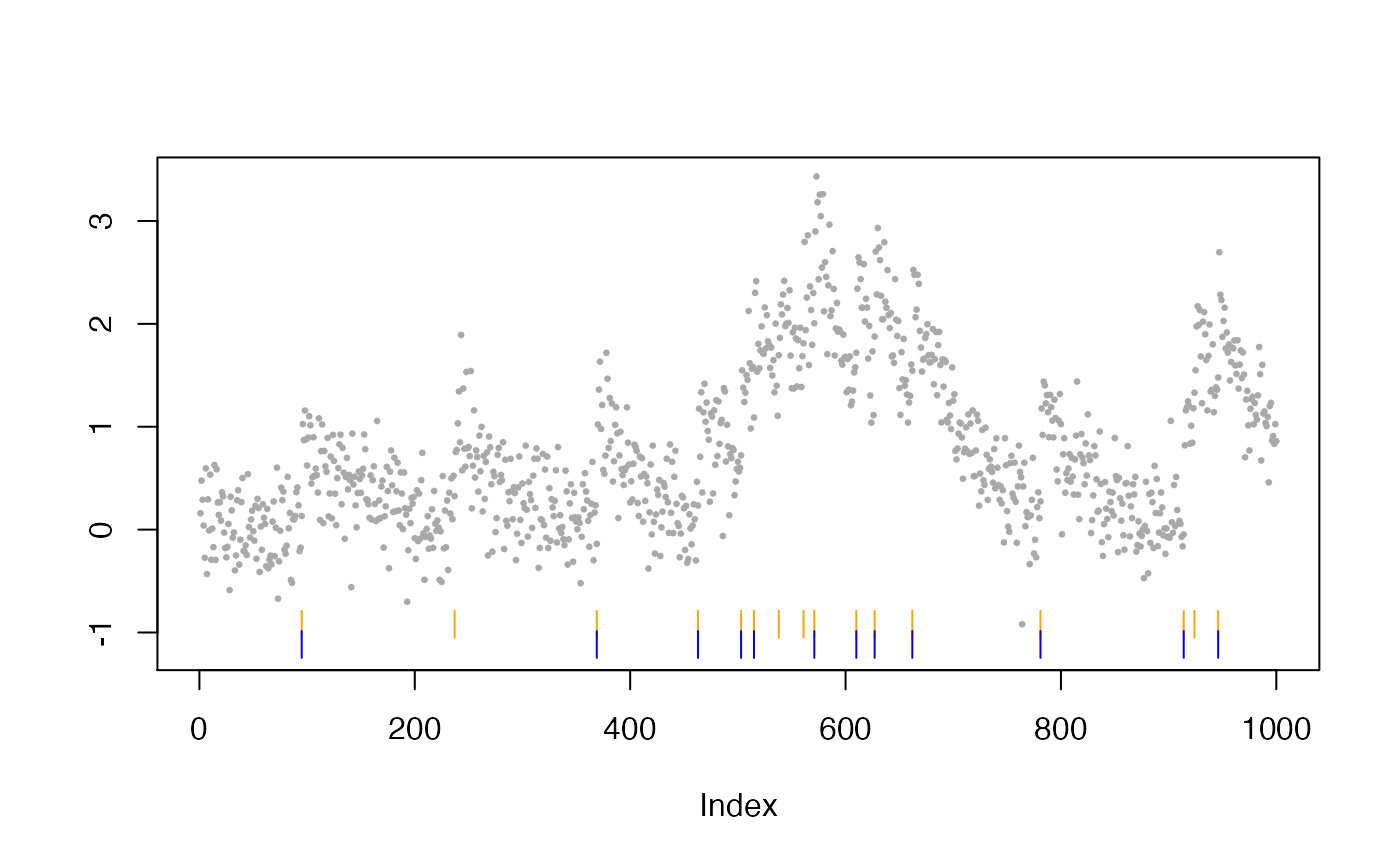
gam <- 0.98
LAMBDA <- 0.7
sigma <- 0.3
n_length <- 1000
curr_sim <- simulate_ar1(n = n_length, gam = gam, poisMean = 0.01, sd = sigma, seed = 2)
curr_inference_spike <- spike_inference(dat = curr_sim$fl, decay_rate = gam,
 tuning_parameter = LAMBDA, window_size = 2, sig2 = sigma*sigma, return_ci = TRUE)
### The observed fluorescence is plotted in gray, along with two sets of
### vertical ticks: each orange tick represents an estimated spike associated with
### a positive increase in fluorescence, and blue ticks are the subset of spikes
### with a selective p-value < alpha (default to be 0.05).
plot(curr_inference_spike)