Plot simulated data
plot.simdata.RdPlot simulated data
# S3 method for simdata
plot(x, xlims = NULL, ...)
Arguments
| x | output data from simulate_ar1 |
|---|---|
| xlims | optional parameter to specify the x-axis limits |
| ... | to be passed to methods |
Value
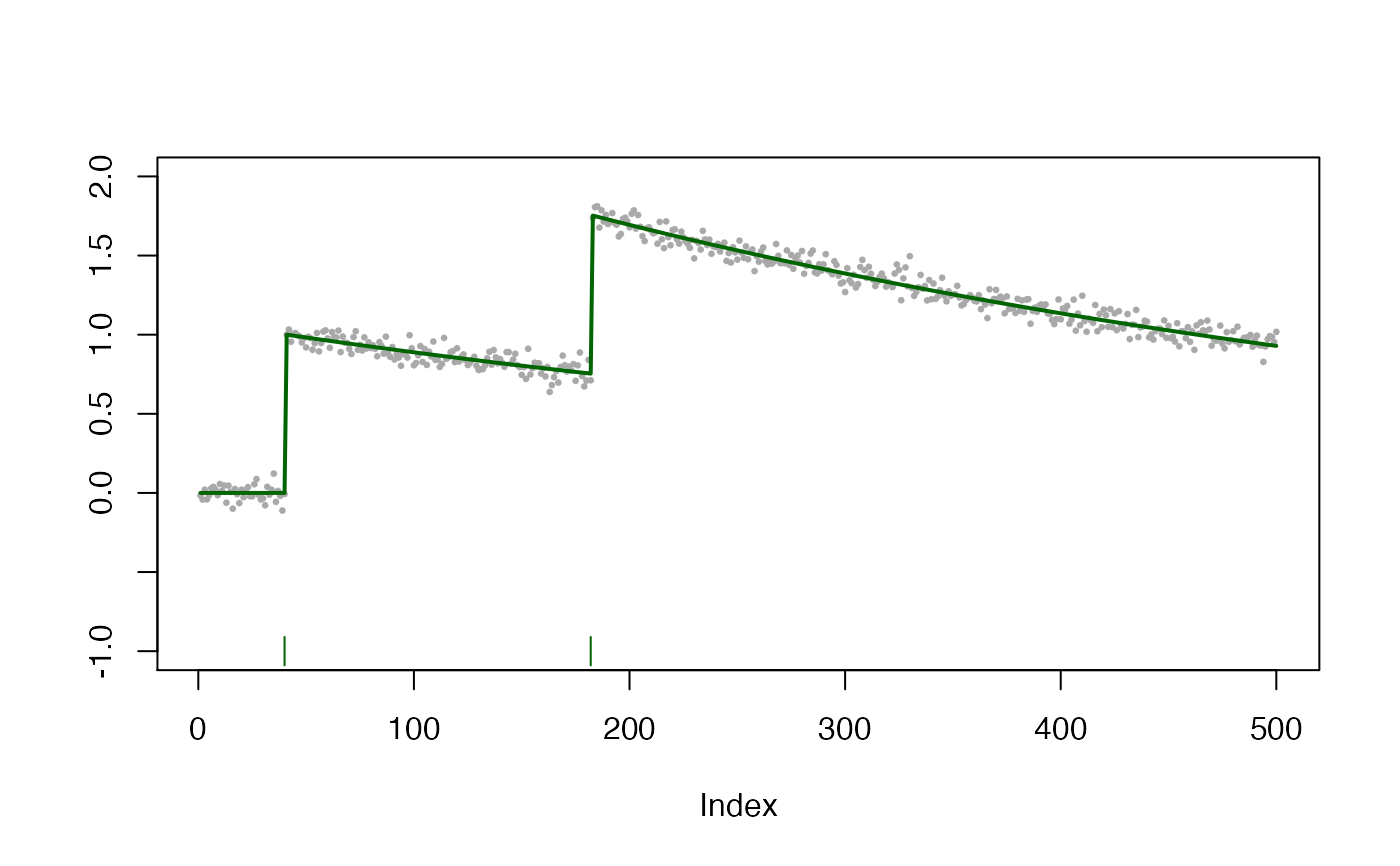
Plot with simulated fluorescence (dark grey circles), calcium concentration (dark green line) and spikes (dark green tick marks on x-axis)